The answer is most companies do make the effort, but are limited by the accessibility to the data and the tools that can easily manipulate the data into credible information. Therefore, the effectiveness of the effort is limited.
One of the key problems in developing an accurate forecasting process is the inability to obtain a thorough, real-time view of forecast variations. Most forecasts are developed based upon static information and assumptions, and the usual differences between actual demand and forecast demand are often misinterpreted, resulting in attempts at fixing a non-existent problem. This causes a chain reaction of events that cascade down through the company, often resulting in higher inventories, poor customer delivery performance, longer customer order lead times, and increased overhead costs due to excessive changes to production plans.
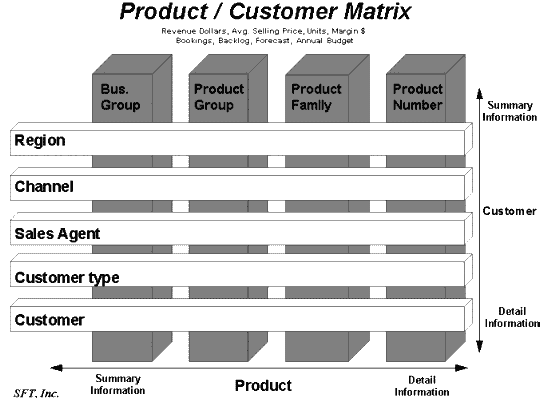
To obtain the highest quality forecast, a thorough understanding of products and
customers must be obtained. To complete this analysis, the data must be segmented by
a combination of customer, product line, sales region, sales channel, units, revenue,
average selling price (ASP), costs, and time-frame. To review a forecast with this
degree of detail, it is necessary to manipulate the data in several combinations of
these segments to see how well the past trends align with the future predictions.
On a regular basis, often weekly and sometimes daily, the task becomes impossible
without adequate tools.


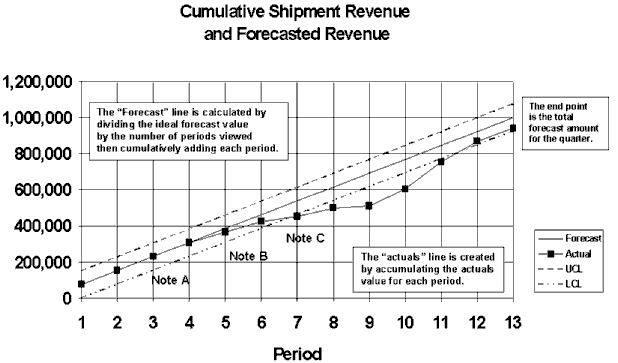
A possible result is finding that the graph represents a normal trend in the business with no corrective actions necessary. It is also possible that the total revenue versus forecast may be in sync (note A), however mismatches may exist in the unit, average selling price, customer or product type mixtures. In each case, this information would not be known unless this type of analysis were available as well as being in place for some time in order to understand the long term trends as well.
An achievable process is one that provides Sales with the ability to perform adequate demand
analysis so they can provide their "best" estimated forecast. Most often, the Sales / Marketing
organization is in the best position to employ the most current information about the forecasted
demand requirements, nevertheless, those requirements can change quickly today's economy.
In reality, both groups must recognize that the forecast is the best understanding at that time and
that there will be errors. The emphasis is to reduce the adverse impact. This is achieved by managing
the forecast errors quickly and efficiently by using exception planning and real-time demand trend
analysis. The key to success is to empower both groups with meaningful real-time information and
business motivations for joining together in the corrective action process.
The issue is further compounded by several logistical difficulties in managing and manipulation of the data.
Spreadsheets are often used; however they are inadequate for this degree of analysis. MRP, WIP and
financial software packages usually do not include such analytical capability as their primary objective is
to meet accounting requirements, to control user transaction screens and to integrate with other software
modules.
Stewart~Frazier Tools, Inc. (SFT) develops and distributes Business Planning Tools and Decision support software
applications. SFT has developed a software package called the Demand Planning Tool (DPT)
that uses downloaded data from the Order Management system to assist in analyzing and manipulating information in
order to make such detailed assessments. DPT is a Microsoft® Windows(TM) decision support
software application with features specifically designed for analyzing and comparing the forecast with demand.
A unique feature of DPT is the ability to merge multiple forecast inputs from several users. This distributes the
process over the individuals who best know the sales situation. It also make the most sense with logistics for
remote sales offices and departments.
©1995 by Stewart~Frazier Tools, Inc. - all rights reserved
Difficulties in Achieving This View
A study of several companies reveals that four main issues cause the difficulties in performing
the cumulative graph analysis on a real-time basis:
Competing Goals
The sales / marketing function is compensated by commission on revenues. It is a more preferable
situation to have a greater supply than actual demand to meet those commission objectives.
The Finance group pressures the Operations group to ensure that minimal inventories exist.
Further, operations must be poised to react to change in several areas: material procurement,
quality issues, build schedules, overtime and managing costs. This situation often puts these
groups at odds with each other. Negative feelings build as time goes on. Each group begins to
wonder if the other is competent. Sales / Marketing doesn't feel the pain when things go wrong
in Operations, and Finance / Operations can't understand why Sales can't provide an accurate
forecast.Inherent Difficulties in Forecasting
An examination of the "forecast versus build" situation reveals that a very high emphasis is placed
on obtaining an "accurate" sales forecast. However, without an equally important emphasis placed
on obtaining a quantifiable assessment of demand trends, the "accurate" forecast is an unlikely
outcome.Forecast Data versus Production Build Data
Forecast data is typically shown by sales agent, sales channel, and customer, while the production build
schedule is the summation of all individual sales forecast represented only by part numbers and scheduled
units to accommodate most MRP systems. This is a significant factor in getting the two mentioned groups
together. When Operations tries to inform Sales that there are "x units" of an excess part number, it
is not clear as to how the forecast was inaccurate nor if the part number was from one or several
individual sales manager forecasts. So who needs to take the action? Clearly, further analysis is needed
to make the decision, but who will have time in either group?Recommended Solution
The most significant obstacle is the lack of an effective process to segment and align forecast data with
previous demand data on a real-time basis. Only if this type of comparative data is available will real-time
corrective action occur. The Sales and Operations groups each require their information to be suitably broken
down, but from a common data source, in order to facilitate mutual understanding and joint problem solving.
Established relationships between past forecasts need to be fed back to the forecaster to correct their optimism
or pessimism towards forecasting. Further, this degree of detail can provide Finance and Operations the
ability to plan for revenues, costs, materials and production schedules.Conclusion