The Demand Planning Tool

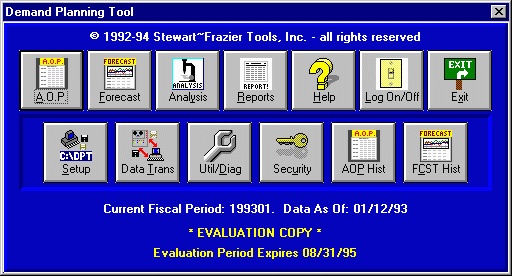
The D.P.T. Main Menu Screen using the supplied test database, running under Windows '95

The Demand Planning Tool has been the culmination of over 5 years of programming effort by the founders of S.F.T. Inc, based on the highly successful concepts of Bandwidth Management, and aimed at the business planning process, where the most significant benefit from overall process improvement can be achieved. By focusing effort on a well-designed Forecast and Annual Operating Plan, based on a "bottom up" method of indivual forecast entries at the individual customer and product level, the Demand Planning Tool becomes a powerful software tool for sales/marketing personnel, managers, and executives to monitor business progress, and measure the plan to the actual execution of the plan. Further, with its concentration on near-instantaneous analysis and exception planning, it becomes practical to use it every day, monitoring progress on a daily basis, and viewing any exceptions to this plan that might result from daily orders that fall outside of the forecast and a statistically derived control band. The end result is a more stable operating plan, a more stable forecast, and a more stable master schedule, as well as better customer delivery performance, and ultimately, shorter customer order lead times.
The Demand Planning Tool is a combination of a long-term Annual Operating Plan development tool, a Forecast Maintenance tool, a Demand Analysis tool, and a custom Report Writer, along with a built-in set of maintenance and security utilities, accessible from the main screen (see the bitmap at the top of this HTML file for a picture of the main screen). Each functional block covers a different part of the planning process. Further, several grouping methods for products and customers have been arbitrarily defined, so that each company that uses D.P.T. can define its own set of major product and customer groups for reporting and planning purposes. Each customer is defined as having a unique Region, Channel, Sales Agent, and Customer Type. Each product is defined as having a unique Business Group, Product Group, and Product Family. And, the information used by D.P.T. is generally extracted directly from the company's Order Management system, in the form of ASCII text files, normally generated on a daily or weekly basis. Extraction programs have already been written for several different accounting packages; however, the text file formats are simple, and sample programs are available to assist in creating the extracts for just about any Order Management system. And, S.F.T. Inc. can assist you in setting up an automated download process to provide a 'hands off' method of obtaining daily or weekly extracts.
One of the most important aspects of the Demand Planning Tool is that all of the departments within a company that need some kind of demand forecast can all operate using essentially the same data as every other department. This way, the company operates with a single consistent plan, stored in a single, common location (such as a computer network), instead of using several different plans, at different levels of aggregation, stored at several different sites (usually spreadsheets or PC databases), and using different numbers. Ultimately, by using the same information source, all of the departments within a corporation can more easily work together to obtain a reasonable operating plan, based on consistent information, rather than fight amongst themselves and attempt to blame one another for problems that result primarily from inaccurate data.
The Annual Operating Plan module allows you to develop an annual operating plan, based on a quarterly forecast, at the Customer Type and Product Group level. It differs from a demand forecast in that you also estimate the burdened unit cost (based on cost of sales) for each customer type and product family, in order to estimate the gross margin associated with each customer type and product family combination. Additionally, an existing forecast can be converted into an Annual Operating Plan, using the 'Total Cost of Sales' entry included in the Product Master table as the estimated cost of sales per unit. Proper use of the Annual Operating Plan module can help in determining profitability, and make revenue predictions from which critical business decisions can be made.
The Forecast Maintenance module allows you to maintaing a month to month demand forecast at the customer and product level. It provides a set of Mechanical Forecast Generators, using several different models: Zero, Average, Linear Regression, Weighted Linear Regression, Decomposition (cyclical plus an averaging effect), and 'Best Fit' (which chooses the least standard error forecast from among the results of each of the other models). Additionally, you can adjust the forecast for the desired customers and products by a specified amount (i.e. +10% to increase by 10%), which is then applied to the individual customer/product detail. And, once a forecast has been generated, you can easily maintain it from the Forecast Maintenance Screen by editing the individual month entries at the product and customer level.
The Demand Analysis module is the primary focus of the Demand Planning Tool. This module provides a means by which you can quickly perform summarized and detail-level analysis on specific products or customers, automatically track Demand Exceptions (demand data which falls outside of the established control parameters), and quickly determine the cause of such exceptions, in order to quickly respond to potential problems, while automatically rejecting those issues which have little or no impact on the business. To do this, D.P.T. generates a Pareto listing of each analysis item, in reverse-dollar order, so that the items with a higher dollar impact appear at the top of the list. The Demand Planning Tool's proprietary technology dollarizes demand exceptions based on a set of parameters that are statistically derived from actual order demand, the current forecast, historic data, and parameters established by the user. The resulting 'high dollar' exceptions then appear first in the list, so that they can be acted upon first. Ideally, the Demand Analysis module can enable you to react to potential problems on the same day that the extract files are generated. And, since non-exceptions are being 'filtered out', over-reaction to sudden (but acceptable) changes in demand are minimized, thus avoiding the usual problems of discovering a problem when it is too late, then over-reacting to it, resulting in even worse problems than before.
Additionally the Demand Planning Tool supplies a comprehensive set of graphs
and standard reports for each module to assist you in your analysis. Below is an example of
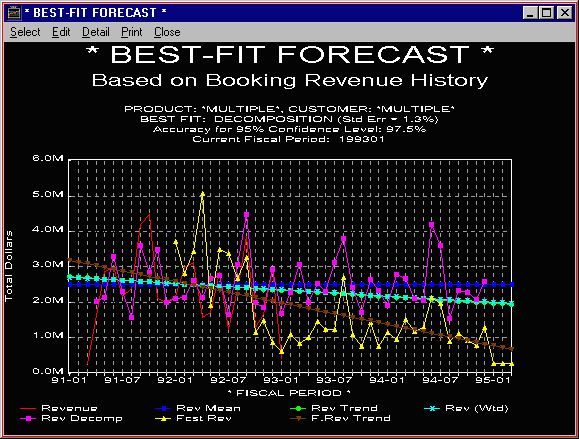
one of the Forecast Module graphs, showing a set of mechanically generated forecasts
(based on aggregate data), compared to one another on the same graph, along with actual data
and the current forecast. Note that in this case, the current forecast is far too small to be
used to derive a master schedule. Thus, the operations department can only guess at what the
plan ought to be, since they have no accurate guidelines, and the net result is sure to be either
material shortages or too much inventory (and therefore higher per-unit costs). This single
graph makes it intuitively obvious to the most casual observer that the forecast is inaccurate,
and suggests which forecast model is likely to be the 'best fit', based on the actual data.

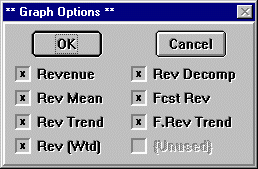
 In order to make it easier to view a graph, the 'Select' menu brings up this dialog box, allowing
you to selectively enable or disable the various lines on the graph. In this case, all lines are
being shown, but the graph may appear a bit 'noisy' and hard to read. So, using this dialog box,
you can disable those lines which you do not need to see, thus making the graph easier to read.
 standard reports were designed to cover the majority
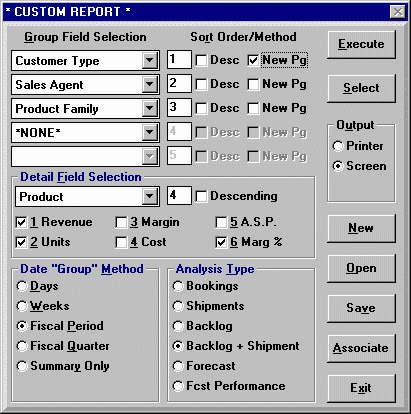
of the reporting needs, there are always needs for special reports. The dialog box shown at the
left is the custom report dialog box for generating 'Forecast' reports. A similar dialog box also
exists for generating 'Annual Operating Plan' reports. Information on actual data that does not involve
the forecast can also be generated from the 'Forecast' custom report dialog box.
Automating the extract process for D.P.T. requires some kind of sheduling system,
one that is capable of launching processes and verifying their completion before
continuing with the next step in the process. With the inclusion of Microsoft's
'Windows Scripting Host'
product in Windows '98, as well as being able to download and install it on Windows '95
and NT 4.0 platforms, automation of the DPT extract process using 'VBScript' or 'JScript'
is now possible without the need to purchase a windows development system.
SAMPLE CODE TO BE PROVIDED AT A LATER DATE
"Well," you may ask, "why should I purchase your Demand Planning Tool when our company can always go and develop a custom tool that does the same thing?" In truth, the concepts behind the Demand Planning Tool are not that complex. In time, with enough effort and software development resources, a company's M.I.S. staff could generate a system that would perform the same equivalent tasks as D.P.T. - but it would cost a LOT more in development time, and could take a year or more to develop. The Demand Planning Tool is available now, and the interface to your existing Order Management system remains under your complete control.
"But all of these other forecasting tools," you may say, "use 'Box Jenkins' and 'Exponential Smoothing' and lots of sophisticated modeling techniques. Why don't you do this?" It has been our experience at S.F.T., Inc., that sophisticated forecasting models are only as good as the data being fed into the model's algorithm. Typically, the more sophisticated models are computationaly expensive, and tend to re-inforce 'artificial seasonality', often caused by poor business practices such as 'end of the quarter revenue push' and excessively long order lead-times. And, since you cannot really know all of the variables that might affect your business for an appropriate computer model, we focus instead on giving the sales force and upper-level management the tools necessary to easily monitor their own performance against the forecast, and make adjustments as needed. We have also found that a mechanical forecast generated with an average line or linear regression line has a 'smoothing out' effect on plant capacity and master scheduling, and can help to indirectly reduce other 'hidden cost' areas of the business that result from an unstable forecast.
"Why," do you ask, "don't you have a network server-based SQL engine, or use an established
DBMS system like Oracle(tm) to run your queries like every other analysis package?" Again, we based our
design on actual experience in working with network and mini-computer systems. Typically, a single server taxed
with the kind of analysis needed to run the exception planning reports (as one example) would undoubtedly do
very well if only a single user were on the network. It would be like having an extremely fast workstation.
Normally, however, you have MANY users on the network, all competing for CPU access and disk access, thus
loading the server with an excessive amount of processing work.
Most networks are already loaded as much as can be expected, and often overloaded due to a high requirement for
network access by users, and a limited budget for hardware procurement. Even so, 10 users with P5 desktop computers
can easily out-perform a client/server system for heavy analysis, through the effect of Distributed Processing.
If you use a network server that has 10 times the computing speed of the fastest desktop machines, 10 desktop machines
running D.P.T. will outperform a similar 'client/server' strategy, by performing the analysis on the desktop machines
instead of on the server. And, we expect a typical company with such a high speed server to have more than 10 users
wanting to use D.P.T., thereby making our Distributed Processing solution the ideal one.
In addition, we have designed the Demand Planning Tool around a high-speed multi-threaded database engine
with a proprietary database format, designed explicitly for the kinds of analysis done by the Demand Planning
Tool. Calculations are done 'on the fly', rather than operating with pre-calculated summary data, thus
minimizing the amount of processing time in the download process. We have found that an efficient database engine on a
user's P.C. is more than adequate to process tens of thousands, or even hundreds of thousands of records' worth of
historic data, and still have adequate performance speed to deliver the desired information in a relatively
short period of time.
©1995-2008 by Stewart~Frazier Tools, Inc. - all rights reserved